Radar
Reading time:
Radar charts use radial axises to represent values.
It consists of evenly spaced segments (axes) radially arranged around a point. There is a segment for each data value of the second dimension. The value of each measure is shown by a node on the relative axis. Values belonging to the same series are connected by a line, which creates the polygon shape of the graph.
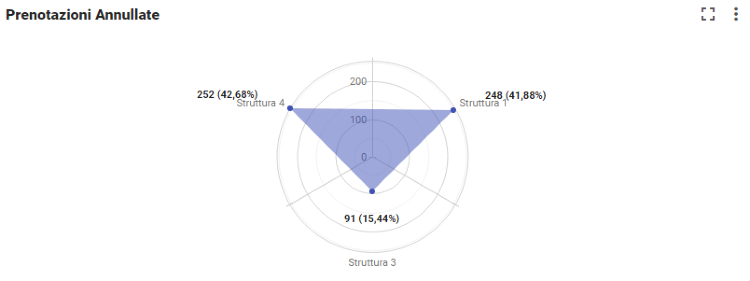
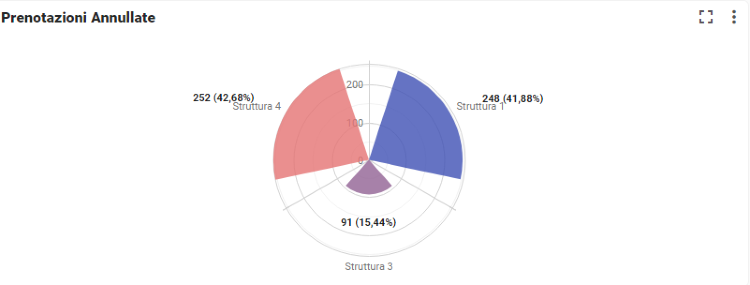
Selection can be done on the points or directly on the area.
Last update: 13 February 2026
Views: 607