Grids option
Reading time:
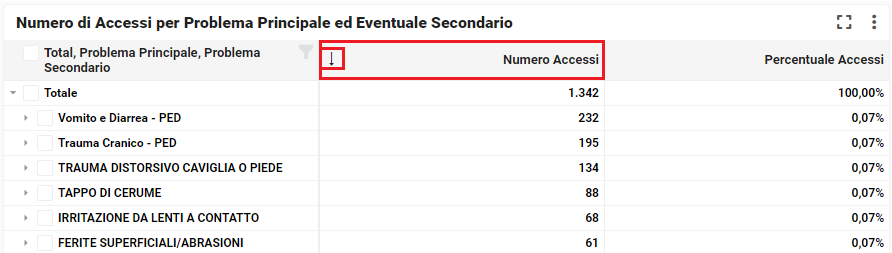
Data ordering
Simple and group grid can be ordered values on the fly.
Clicking on the header enable the ordering.
The criteria is visible by the arrow icon (ascendant or descendant).
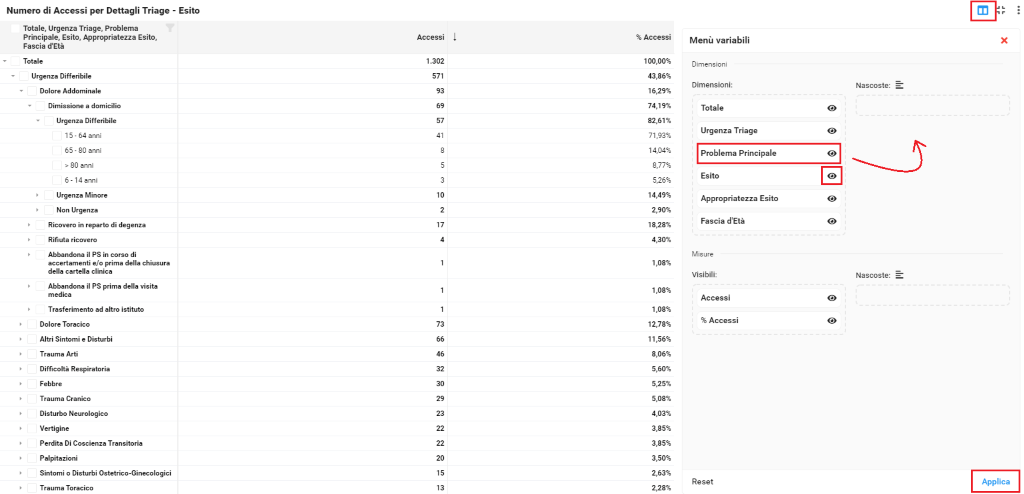
Column chooser
Column chooser (or variables menu) is a tool that allow to customize modules layout.
If active, you'll see an icon on the title bar, next to the full-screen one.
When opened you'll see the current configuration of the module. From there you can change (hide or show) information by drag and drop them or from the "eye" button.
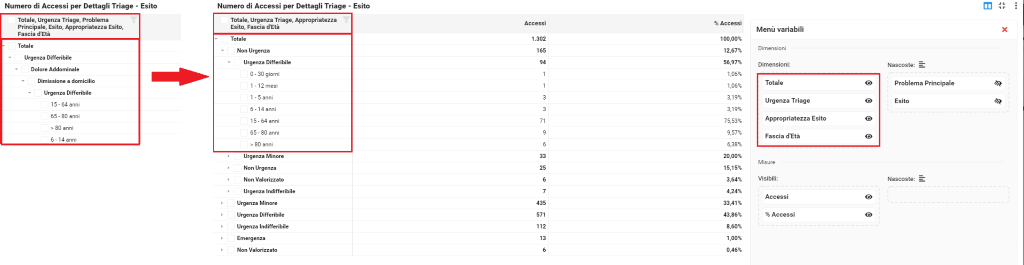
To save the configuration and load the new layout, click on "Apply".
Example of layout before and after the use of the column chooser.
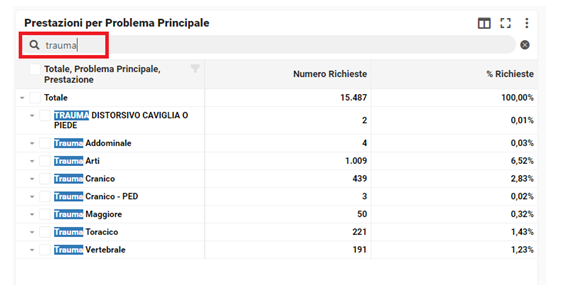
Search
Grids allow to make research of values from the top bar.