Aid to interpretation
Reading time:
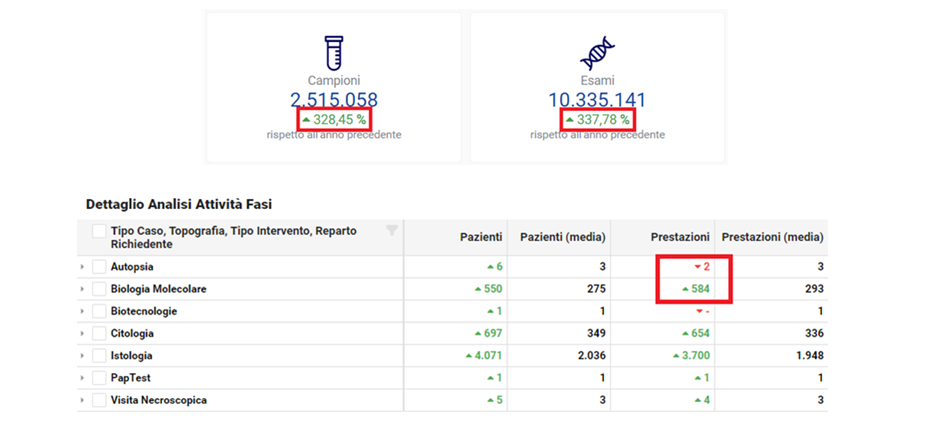
- Intuitive indicators for the representation of anomalous or out-of-range values, with indicative colors and icons over / under threashold
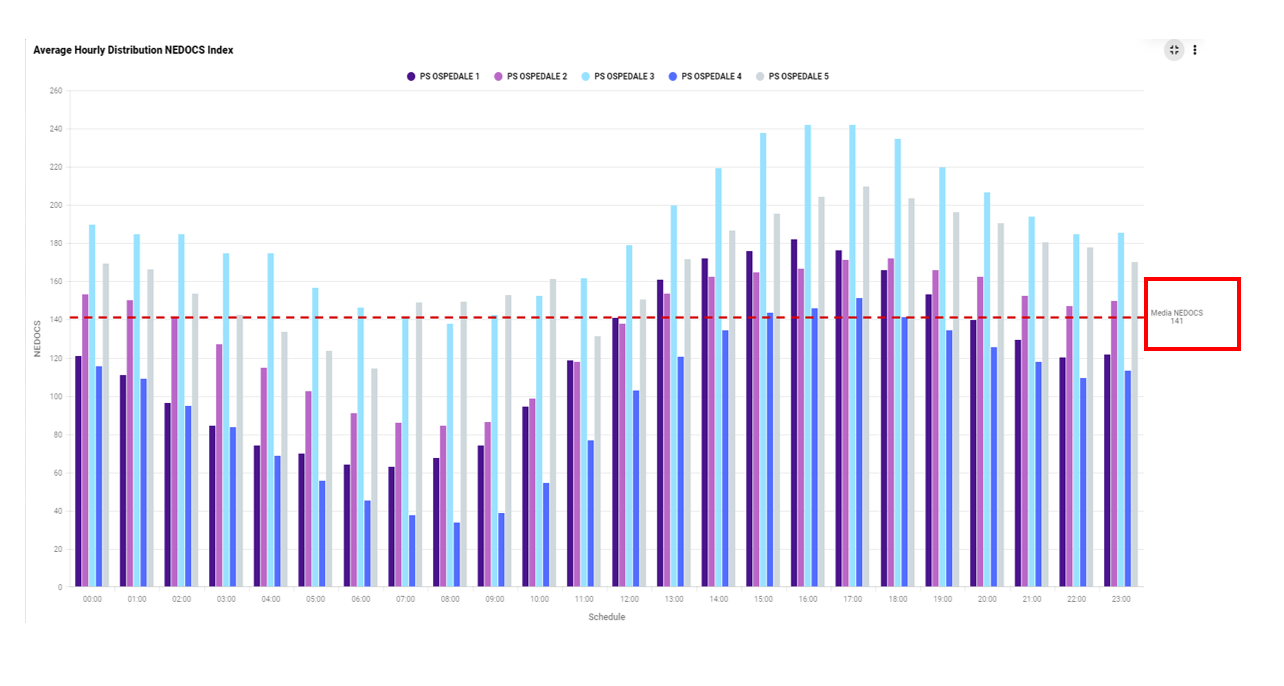
- The charts can include the representation of the average value, automatically recalculated when the displayed data changes
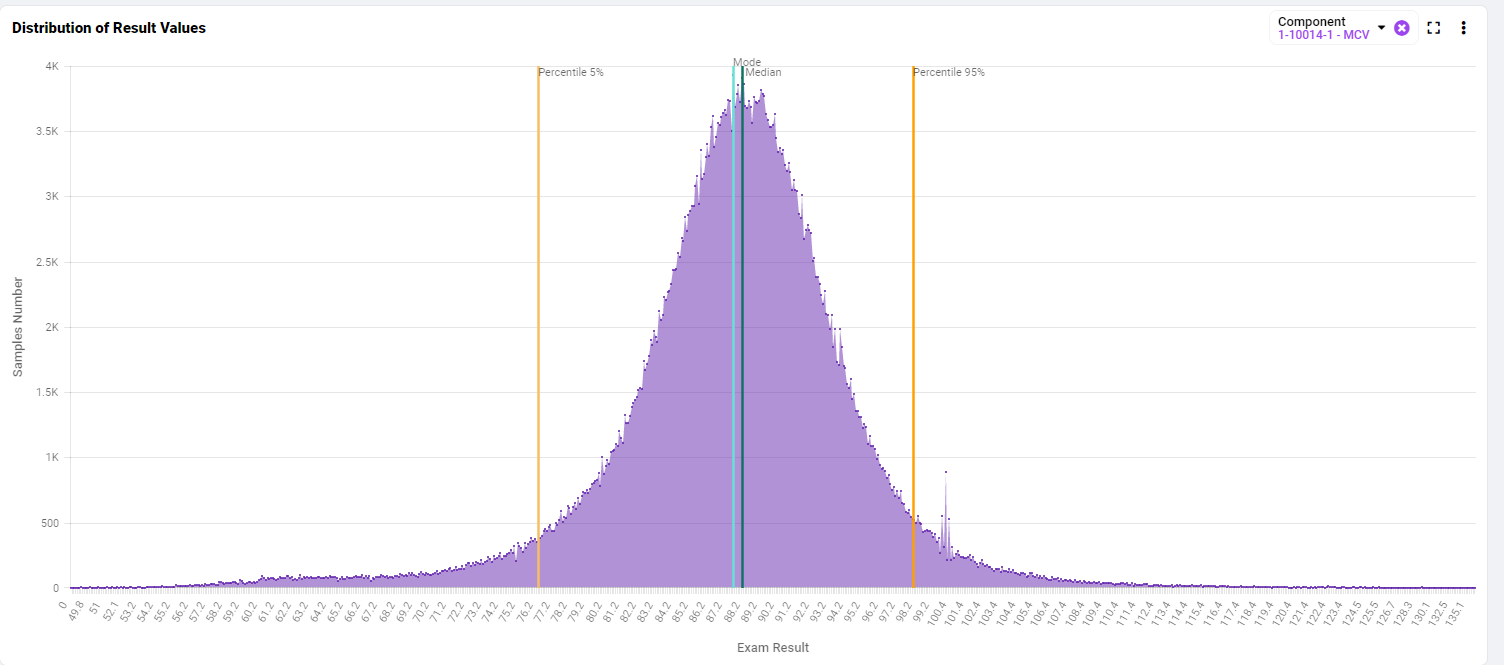
- Magnitude bars can also be displayed to easily locate values beyond a standard threshold
Last update: 19 August 2025
Views: 756