Lines
Reading time:
Line charts represent data on XY axis.
Lines could be broken or rounded based on the data type to be represented.
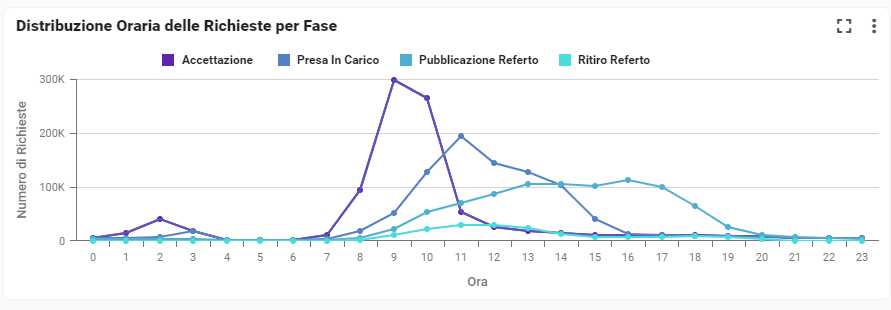
The selection could be done by the point displayed of the desired variable.
How to add a line chart?
Last update: 13 February 2026
Views: 1030