Salta al contenuto

Documentation BI4H (EN)Documentation BI4H (EN)

  • Quick Start
  • Navigation
  • Interactions
  • Charts
  • Tables
  • Filters
  • Modules
  • Data Explorer
  • Self service
  • Quick Start
  • Navigation
  • Interactions
  • Charts
  • Tables
  • Filters
  • Modules
  • Data Explorer
  • Self service
  • Quick start

    • Start up

    • Profile

    • Top tool bar

      • Change theme layout
      • Language selection
    • Elements of BI4H

    • What is the HUB

    • What is the APP

    • What is a module

  • Navigation

    • Tiles & child buttons

    • Navigation bar

    • Stepper

    • Sidenav

    • Bookmarks

    • Schedule

    • Global search

  • Interactions

    • Point & click interaction

    • Change chart type

    • Export widgets

    • Fullscreen

    • Additional details

    • Modal windows

  • Charts

    • Lines

    • Colums

    • Composed lines-columns

    • Bars

    • Area

    • Bubble

    • Pie

    • Heatmap

    • Funnel

    • Treemap

    • Geographical maps

    • Gauge

    • Scatter plot

    • Range

    • Sankey

    • Radar

  • Grids

    • Grids option

    • Simple grids

    • Group grids

    • Pivot

  • Filters

    • Smart Filter Bar

    • Filter layout

      • Single filter
      • Group filter
      • Expanded filter
      • Tree filter
      • Builder filter
      • Search filter
    • Filter types

    • Filter options

    • Interactions

  • Modules

    • Numbers

    • Tab

    • Buttons

    • List Indicator

    • Street maps

    • Aid to interpretation

  • Data Explorer

    • Introduction

    • Configuration

      • Edit module -> Generals
      • Edit module -> Aspect
      • Edit module -> Sharing
    • Create a new query

      • Add fields from Univers
      • Add fields from tables/snippets
      • Conditions sections
      • Advanced mode
    • Existing query

      • Run an existing query
      • Create a query using existing query
    • Sharing

      • Share a query
      • Run a shared query
    • Export results

    • Query category

  • Self service

    • Your first dashboard

      • Adding a new page to the app
      • Adding modules to the page
    • Edit Module -> DATA tab

      • Dimension & Alternative Dimension
      • Measures & Alternatives Measures
      • Categories for alternative data
      • Name of dimensions & Measures
      • Sorting of Dimensions & Measures
      • Visibility of Dimensions & Measures
      • Measures Formatting
      • Measures Threshold
    • Edit Module -> ASPECT tab

      • Title customization
      • Show Legend & Customization
      • Box colors
      • Split module
      • Box Options
      • X Axis
      • Y Axis
      • Chart Colors
      • Type (Rotate, Invert, stack)
      • Zoom
      • Tooltip
      • Average
      • Values
      • Change type
      • Other (Aspect)
    • Edit Module -> INTERACTIVITY tab

      • Action
      • Filters
      • Data
      • Other (Interactivity)
    • Edit page - Generals tab

    • Edit page - Options tab

      • Options (Page)
      • Filters (Page)
    • Edit page - Info tab

    • Edit page - Other tab

    • Rendering examples

      • Column chart combined with a line
      • Stacked chart
      • Chart with opposite axis
      • Chart with a constant line
  1. Docs
  2. Filters
  3. Interactions

Interactions

Reading time:

The dashboards can provide a set of filters that can be configured from time to time, in guided mode, to decline the data according to different analysis factors.


For example, filters applicable to the analyzed population can be: the setting of a reference time period, exclusion / inclusion of certain age groups, exclusion / inclusion of pathologies, exclusion / inclusion of geographical areas, etc.


All the indicators in the dashboard are then dynamically recalculated after the application of the various criteria, to show contextual data to the user's choices.


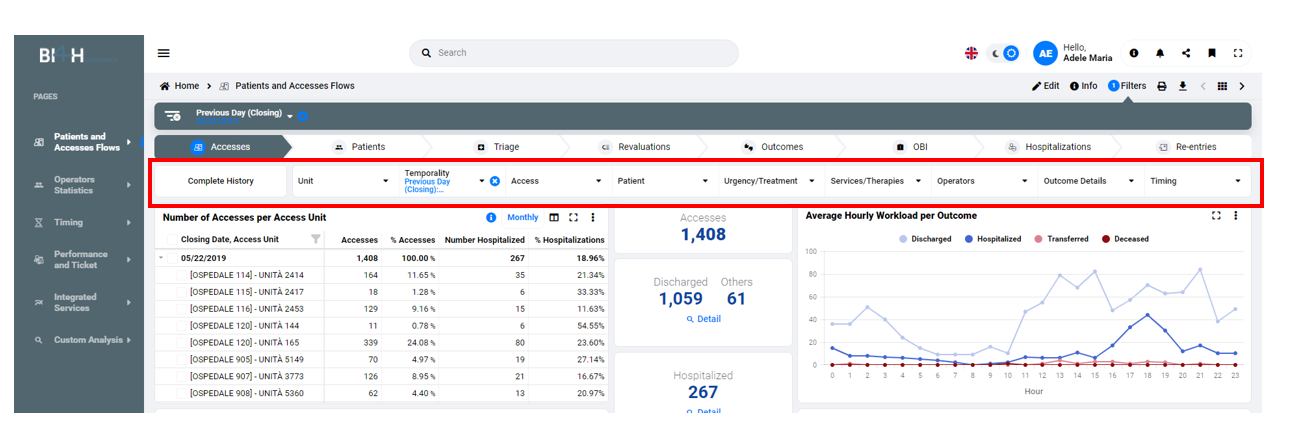
Filters can be page-level (usually located at the top)


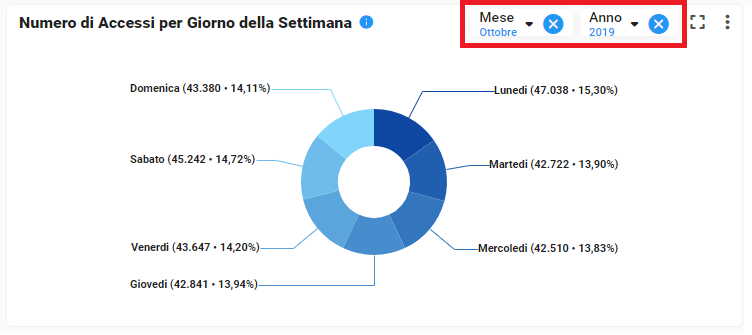
Or integrated directly on the widgets (in the title bar)


It is possible to set the opening of a dashboard with 'pre-set' filters, which allow you to have the initial analysis immediately declined with certain criteria applied.

These values ​​can then be changed by the user at any time.

The setting of a certain filter has a 'cascade effect' on the other selectable values, so all the options in the other filters will be excluded if they cannot coexist with the criterias already applied.

The Smart Filter Bar explicitly summarizes the filter values ​​set, in a synoptic way, to have constant control of the analysis criteria applied to the statistics.

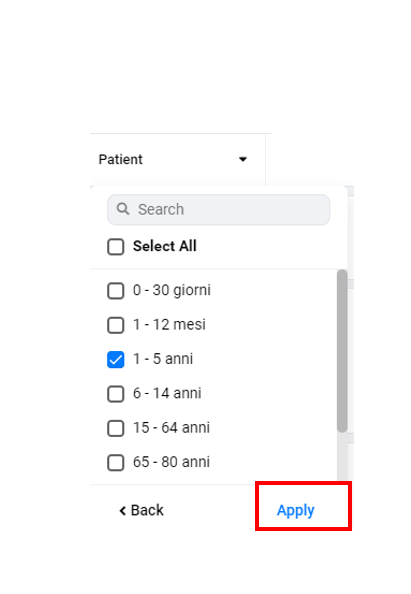
The application of the filter selection is effective when the user clicks the 'apply' button.

If you exit the filter before applying the changes, the changes are lost.


TOOLTIP 

By mouse-hovering the filter bar, the list of all the selected items is shown with a tooltip, which in any case is always available in reduced form even on the filter itself.
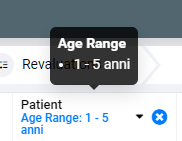


SEARCH

You can search for selectable values ​​in text filters, with full-text search mode.
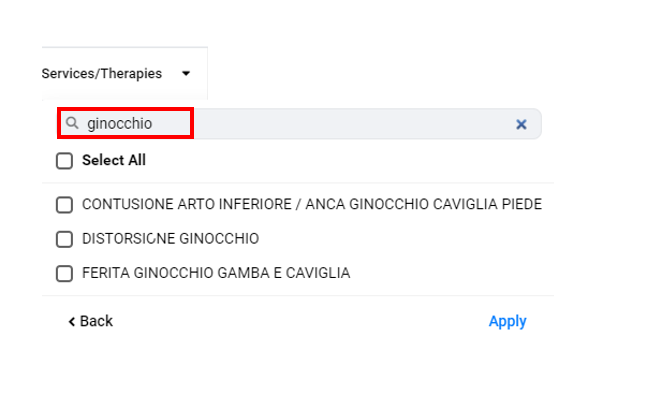

SELECT ALL

Once the 'select all' option has been selected, the next click will have the function of deselecting all active items.
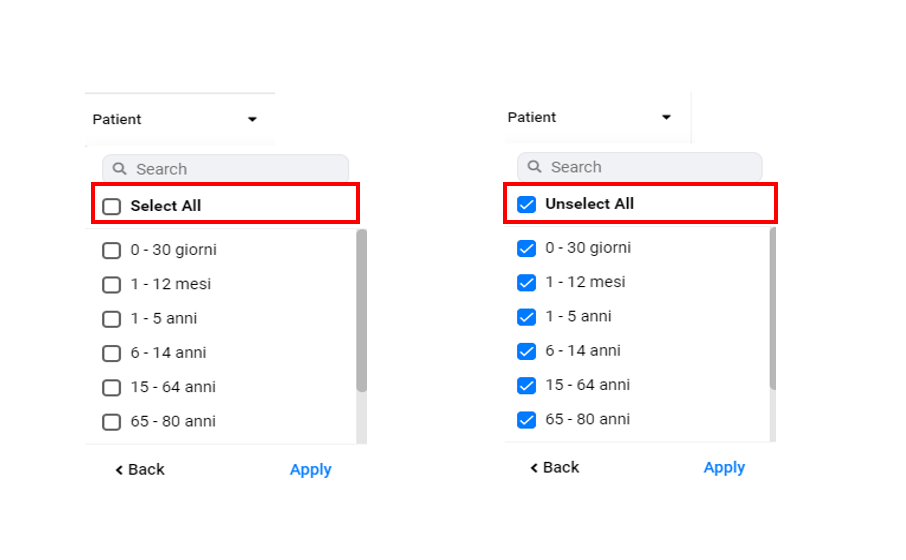
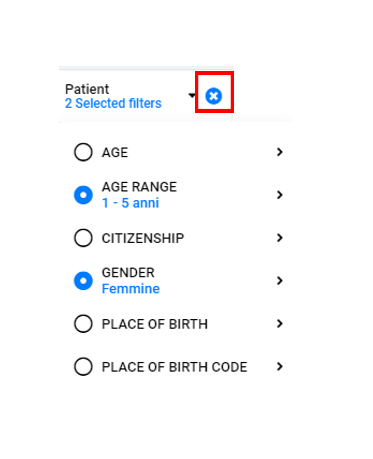

DELETING 

The icon next to the filter allows you to delete all the filters applied, which are not of the preset type.

In the case of a group filter, the action concerns all the dimensions in the list (in the example it would reset the age group and sex filters).


Last update: 7 October 2024
Views: 372

© 2025 Documentation BI4H (EN)

Powered by WordPress

All'inizio ↑ Su ↑