Salta al contenuto

Documentation BI4H (EN)Documentation BI4H (EN)

  • Quick Start
  • Navigation
  • Interactions
  • Charts
  • Tables
  • Filters
  • Modules
  • Data Explorer
  • Self service
  • Quick Start
  • Navigation
  • Interactions
  • Charts
  • Tables
  • Filters
  • Modules
  • Data Explorer
  • Self service
  • Quick start

    • Start up

    • Profile

    • Top tool bar

      • Change theme layout
      • Language selection
    • Elements of BI4H

    • What is the HUB

    • What is the APP

    • What is a module

  • Navigation

    • Tiles & child buttons

    • Navigation bar

    • Stepper

    • Sidenav

    • Bookmarks

    • Schedule

    • Global search

  • Interactions

    • Point & click interaction

    • Change chart type

    • Export widgets

    • Fullscreen

    • Additional details

    • Modal windows

  • Charts

    • Lines

    • Colums

    • Composed lines-columns

    • Bars

    • Area

    • Bubble

    • Pie

    • Heatmap

    • Funnel

    • Treemap

    • Geographical maps

    • Gauge

    • Scatter plot

    • Range

    • Sankey

    • Radar

  • Grids

    • Grids option

    • Simple grids

    • Group grids

    • Pivot

  • Filters

    • Smart Filter Bar

    • Filter layout

      • Single filter
      • Group filter
      • Expanded filter
      • Tree filter
      • Builder filter
      • Search filter
    • Filter types

    • Filter options

    • Interactions

  • Modules

    • Numbers

    • Tab

    • Buttons

    • List Indicator

    • Street maps

    • Aid to interpretation

  • Data Explorer

    • Introduction

    • Configuration

      • Edit module -> Generals
      • Edit module -> Aspect
      • Edit module -> Sharing
    • Create a new query

      • Add fields from Univers
      • Add fields from tables/snippets
      • Conditions sections
      • Advanced mode
    • Existing query

      • Run an existing query
      • Create a query using existing query
    • Sharing

      • Share a query
      • Run a shared query
    • Export results

    • Query category

  • Self service

    • Your first dashboard

      • Adding a new page to the app
      • Adding modules to the page
    • Edit Module -> DATA tab

      • Dimension & Alternative Dimension
      • Measures & Alternatives Measures
      • Categories for alternative data
      • Name of dimensions & Measures
      • Sorting of Dimensions & Measures
      • Visibility of Dimensions & Measures
      • Measures Formatting
      • Measures Threshold
    • Edit Module -> ASPECT tab

      • Title customization
      • Show Legend & Customization
      • Box colors
      • Split module
      • Box Options
      • X Axis
      • Y Axis
      • Chart Colors
      • Type (Rotate, Invert, stack)
      • Zoom
      • Tooltip
      • Average
      • Values
      • Change type
      • Other (Aspect)
    • Edit Module -> INTERACTIVITY tab

      • Action
      • Filters
      • Data
      • Other (Interactivity)
    • Edit page - Generals tab

    • Edit page - Options tab

      • Options (Page)
      • Filters (Page)
    • Edit page - Info tab

    • Edit page - Other tab

    • Rendering examples

      • Column chart combined with a line
      • Stacked chart
      • Chart with opposite axis
      • Chart with a constant line
  1. Docs
  2. Data Explorer
  3. Conditions sections

Conditions sections

Reading time:

CONDITIONS

The development of conditions follows the same logic as the interactions of filters in the dashboards: numerical comparisons, “Like”, selection of time intervals, etc.

To add a new condition, click on the 'Add a condition' button, and then click on the empty box (①), a list of available fields will be proposed, you can enter some keywords to help you (②), and then click on the field to select it (③).

Depending on the dimension format selected, the options offered may be different.

Dimensions selected with string format

The yellow button is located to the right of the selected dimension allowing you to choose the single value or multi values option.

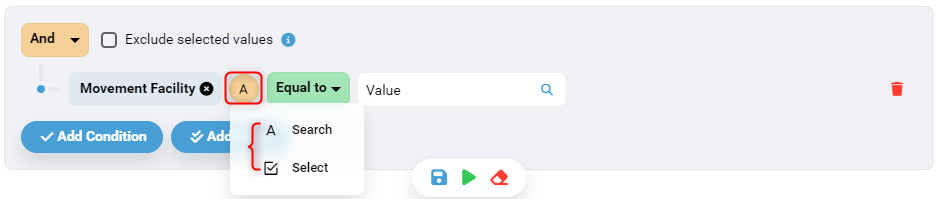
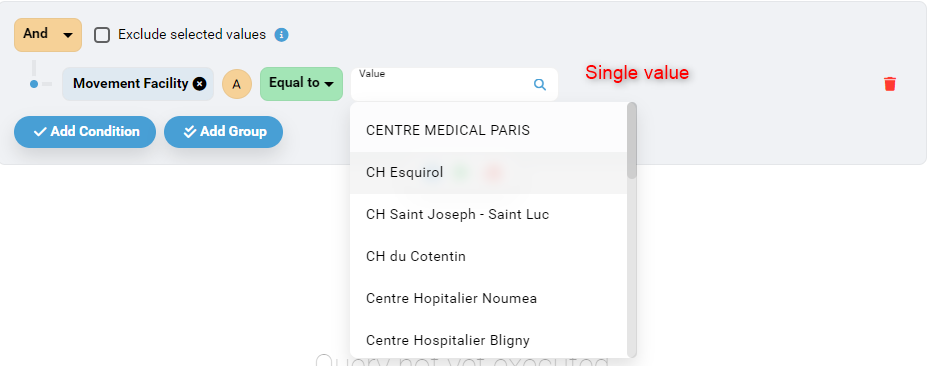
'Search' allows you to do a search and choose a single value

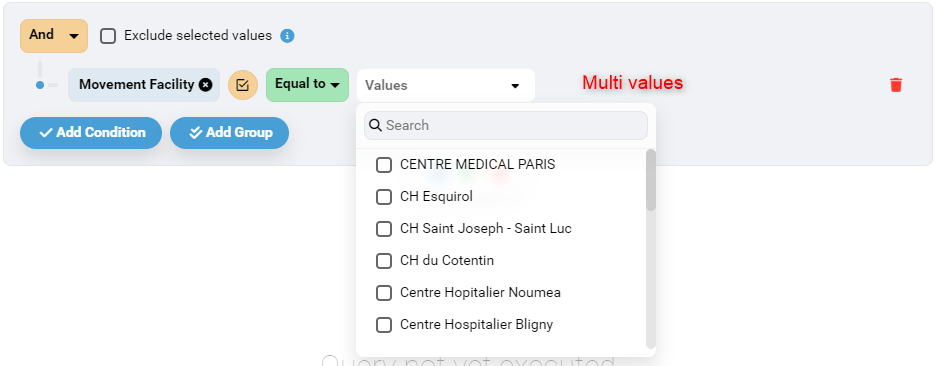
'Select' allows you to select several values from a list

and the operators proposed for the strings are:

  • Equal to
  • Not equal to
  • Contains
  • Does not contain
  • Starts with
  • End by
  • Is null
  • Is not null
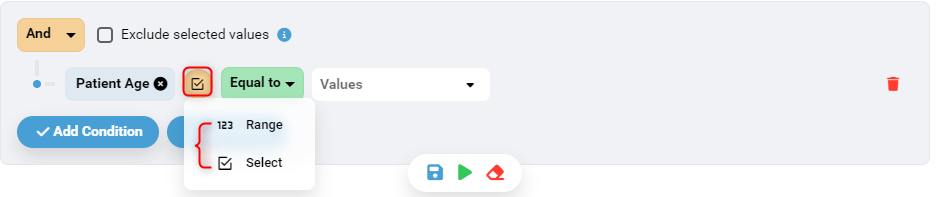
Dimensions selected with digital format

The yellow button to the right of the selected dimension allows you to enter a value manually (Range) or select a value from a list (Select)

and the operators proposed for numerical variables are:

  • Better than
  • Greater than or equal to
  • Less than
  • Less than or equal to
  • Equal to
  • Not equal to
  • Between
  • Is null
  • Is not null
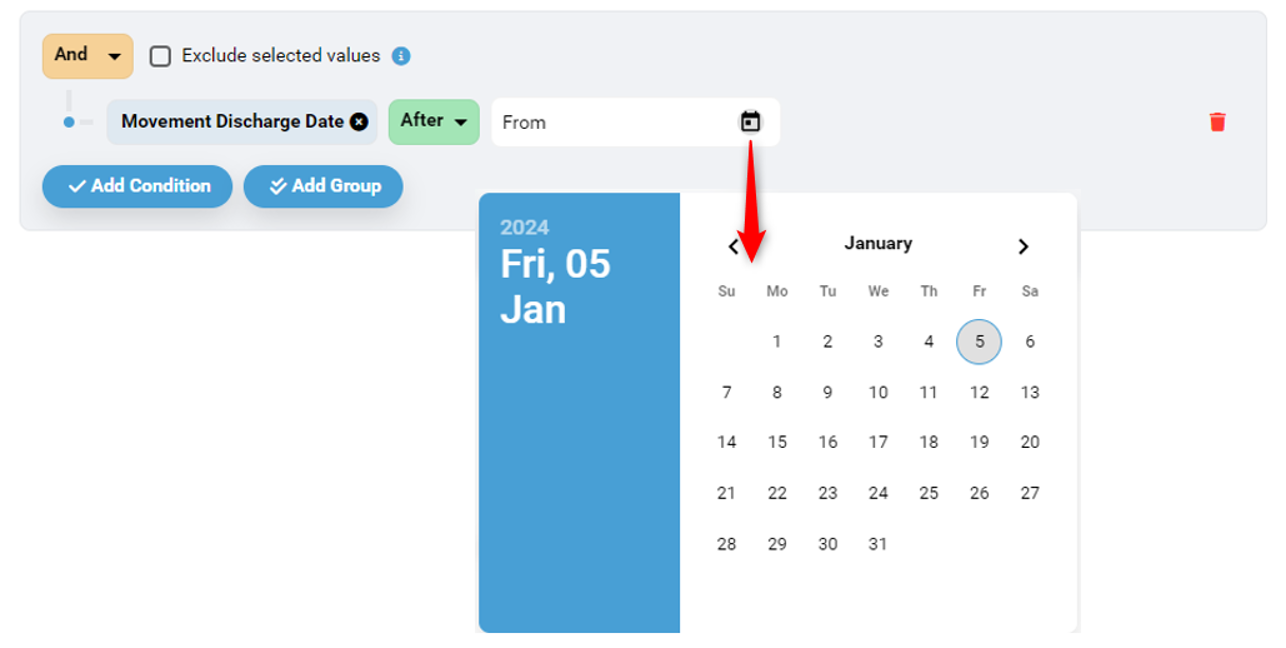
Dimensions selected with date format

A calendar is provided to facilitate entry.

and the operators proposed for date variables are:

  • After
  • Equal to or after
  • Before
  • Equal to or before
  • Equal to
  • Not equal to
  • Between
  • Is null
  • Is not null

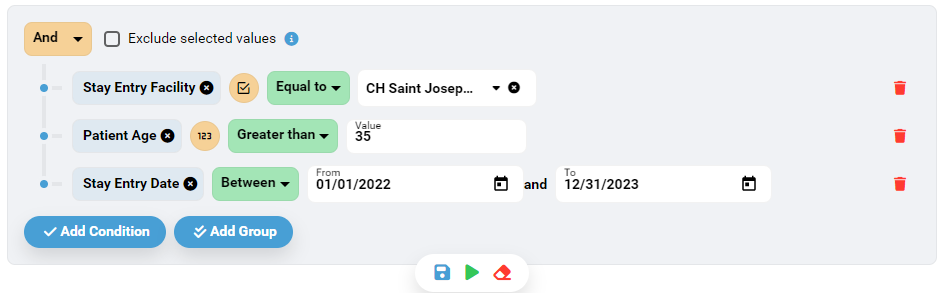
You can add several simple conditions in the query,

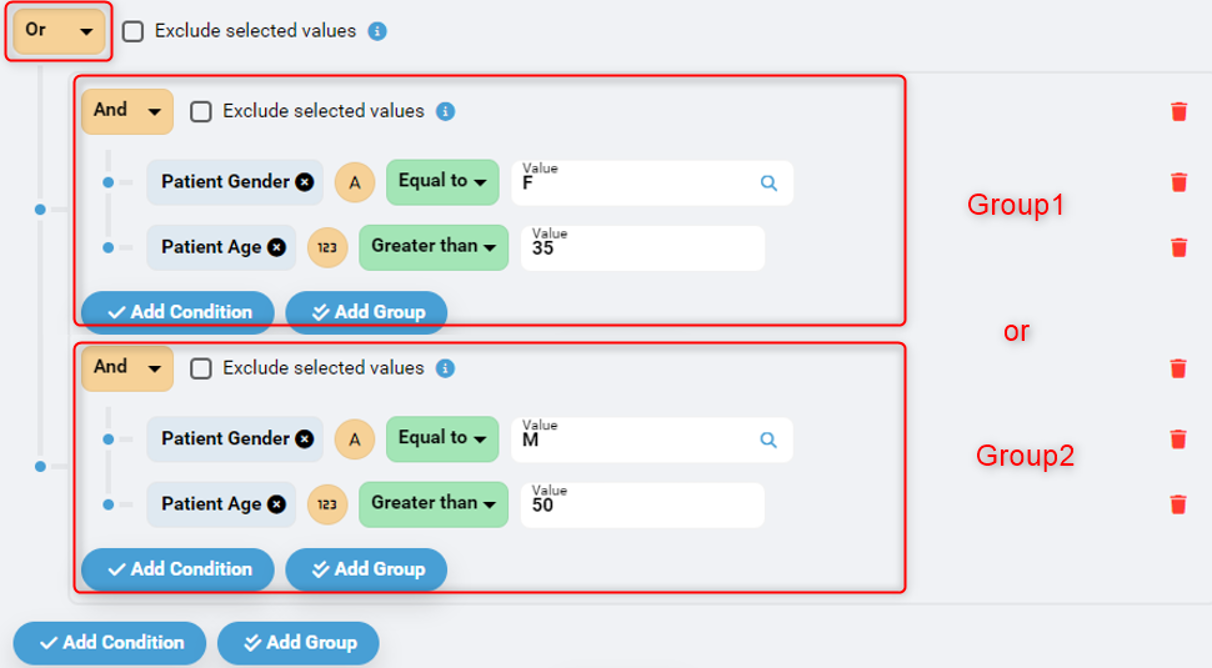
or groups of complex conditions with AND or OR logic.

You can delete the filter by clicking on the 'trash' button which is located to the right of each condition.

AGGREGATION CONDITIONS

In this section we can add the HAVING condition on the measures.

OTHER

'Limit': we can set the number of elements we want to consider.

'Group by': instead of having many rows with the same value in a specific column, with 'group by' we get a single row for each unique value.

Once the extraction is configured, click “Run Query” in the Run menu.

The result is then displayed in a paginated and interactive manner. It is exportable and also contains a search engine.

The total number of rows is provided in addition to the results.

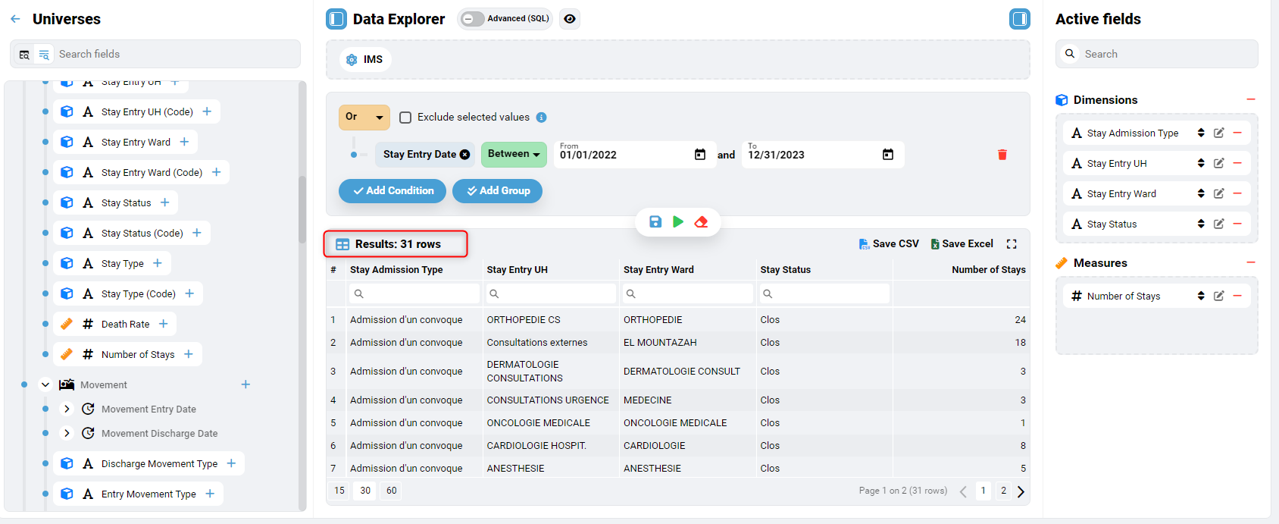
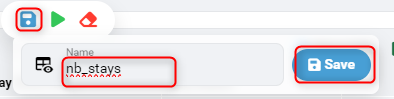
To save an extraction, click on the “Save” icon.

Saved queries are categorized in the view.

Demonstration:

Last update: 3 April 2025
Views: 319

© 2025 Documentation BI4H (EN)

Powered by WordPress

All'inizio ↑ Su ↑