Colums
Reading time:
Column charts show data on XY axis with columns proportional to the values represented.
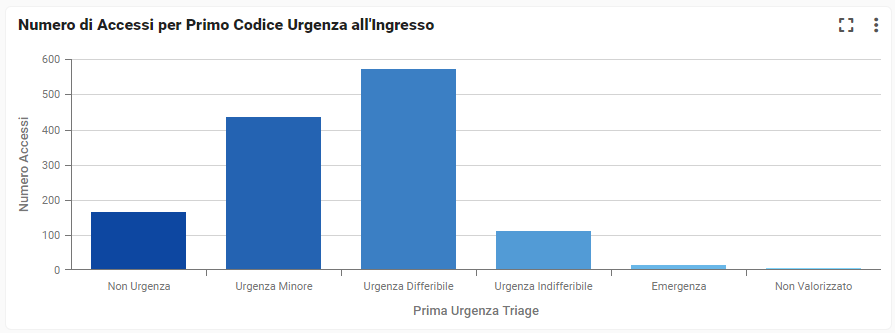
The selection could be on the columns, as for the bar chart.
How to add a column chart?
Last update: 13 February 2026
Views: 774