Bubble
Reading time:
Bubble chart represent values with entities defined by three parameters.
The entities represented can be compared by the dimension and the position than the XY axises.
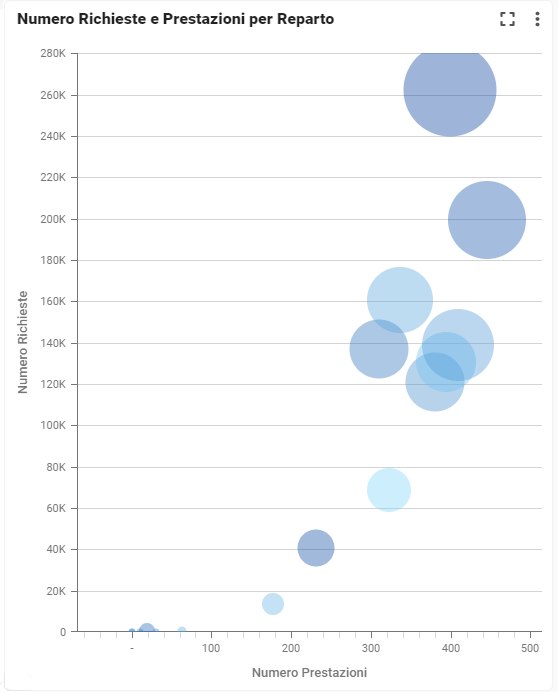
To select on the chart, click on a circle painted.
How to add a Bubble Chart?
YOu need add one dimesion, and three measure for this presentation.
Last update: 13 February 2026
Views: 735