Salta al contenuto

Documentation BI4H (EN)Documentation BI4H (EN)

  • Quick Start
  • Navigation
  • Interactions
  • Charts
  • Tables
  • Filters
  • Modules
  • Data Explorer
  • Self service
  • Quick Start
  • Navigation
  • Interactions
  • Charts
  • Tables
  • Filters
  • Modules
  • Data Explorer
  • Self service
  • Quick start

    • Start up

    • Profile

    • Top tool bar

      • Change theme layout
      • Language selection
    • Elements of BI4H

    • What is the HUB

    • What is the APP

    • What is a module

  • Navigation

    • Tiles & child buttons

    • Navigation bar

    • Stepper

    • Sidenav

    • Bookmarks

    • Schedule

    • Global search

  • Interactions

    • Point & click interaction

    • Change chart type

    • Export widgets

    • Fullscreen

    • Additional details

    • Modal windows

  • Charts

    • Lines

    • Colums

    • Composed lines-columns

    • Bars

    • Area

    • Bubble

    • Pie

    • Heatmap

    • Funnel

    • Treemap

    • Geographical maps

    • Gauge

    • Scatter plot

    • Range

    • Sankey

    • Radar

  • Grids

    • Grids option

    • Simple grids

    • Group grids

    • Pivot

  • Filters

    • Smart Filter Bar

    • Filter layout

      • Single filter
      • Group filter
      • Expanded filter
      • Tree filter
      • Builder filter
      • Search filter
    • Filter types

    • Filter options

    • Interactions

  • Modules

    • Numbers

    • Tab

    • Buttons

    • Chatbot

    • List Indicator

    • Street maps

    • Aid to interpretation

  • Data Explorer

    • Introduction

    • Configuration

      • Edit module -> Generals
      • Edit module -> Aspect
      • Edit module -> Sharing
    • Create a new query

      • Add fields from Univers
      • Add fields from tables/snippets
      • Conditions sections
      • Advanced mode
    • Existing query

      • Run an existing query
      • Create a query using existing query
    • Sharing

      • Share a query
      • Run a shared query
    • Export results

    • Query category

  • Self service

    • Your first dashboard

      • Adding a new page to the app
      • Adding modules to the page
    • Edit Module -> DATA tab

      • Dimension & Alternative Dimension
      • Measures & Alternatives Measures
      • Categories for alternative data
      • Name of dimensions & Measures
      • Sorting of Dimensions & Measures
      • Visibility of Dimensions & Measures
      • Measures Formatting
      • Measures Threshold
    • Edit Module -> ASPECT tab

      • Title customization
      • Show Legend & Customization
      • Box colors
      • Split module
      • Box Options
      • X Axis
      • Y Axis
      • Chart Colors
      • Type (Rotate, Invert, stack)
      • Zoom
      • Tooltip
      • Average
      • Values
      • Change type
      • Other (Aspect)
    • Edit Module -> INTERACTIVITY tab

      • Action
      • Filters
      • Data
      • Other (Interactivity)
    • Edit page - Generals tab

    • Edit page - Options tab

      • Options (Page)
      • Filters (Page)
    • Edit page - Info tab

    • Edit page - Other tab

    • Rendering examples

      • Column chart combined with a line
      • Stacked chart
      • Chart with opposite axis
      • Chart with a constant line
  1. Docs
  2. Modules
  3. Chatbot

Chatbot

Reading time:

The Chatbot in BI4H is a conversational interface embedded in the platform. It allows users to interact with integrated data using natural language, making data exploration more intuitive and accessible.

Key Features

  • Natural Language Input: ask questions in plain language no need to know technical language as SQL
  • Autocomplete Suggestions: suggestions of keywords and variables while typing
  • Multilingual Support: English, Italian, French, German
  • Export Options: export results as PDF, XLS, CSV, or image

How it works

When you are on a chatbot page, you could find suggested queries at the bottom of the page. You can click directly on a suggestion button to see how the chatbot works.


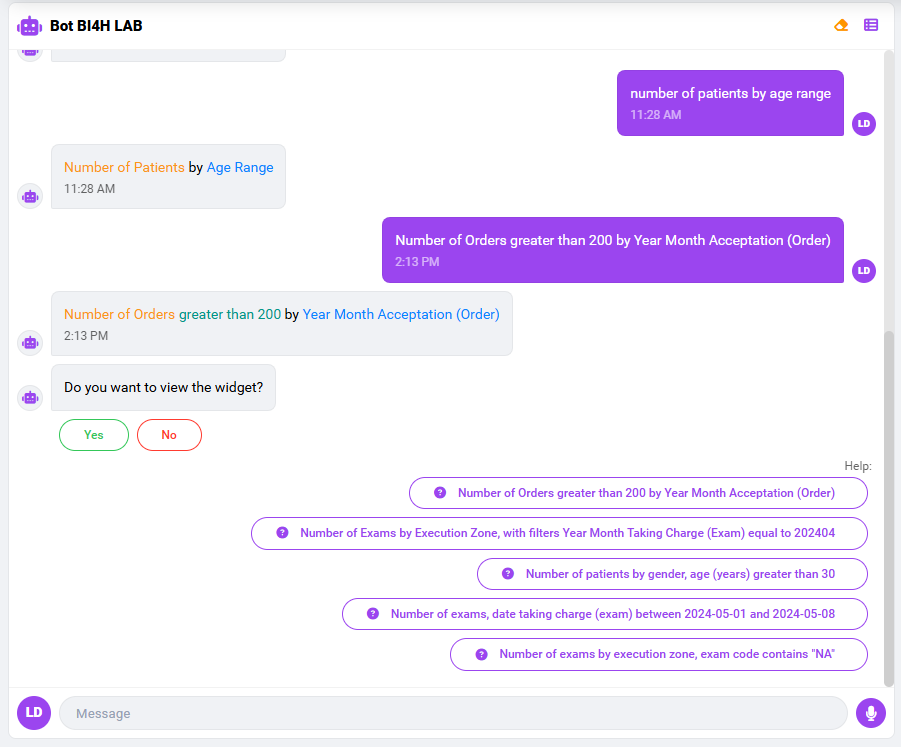
The number of orders by year of acceptance and by urgency level


List of fields

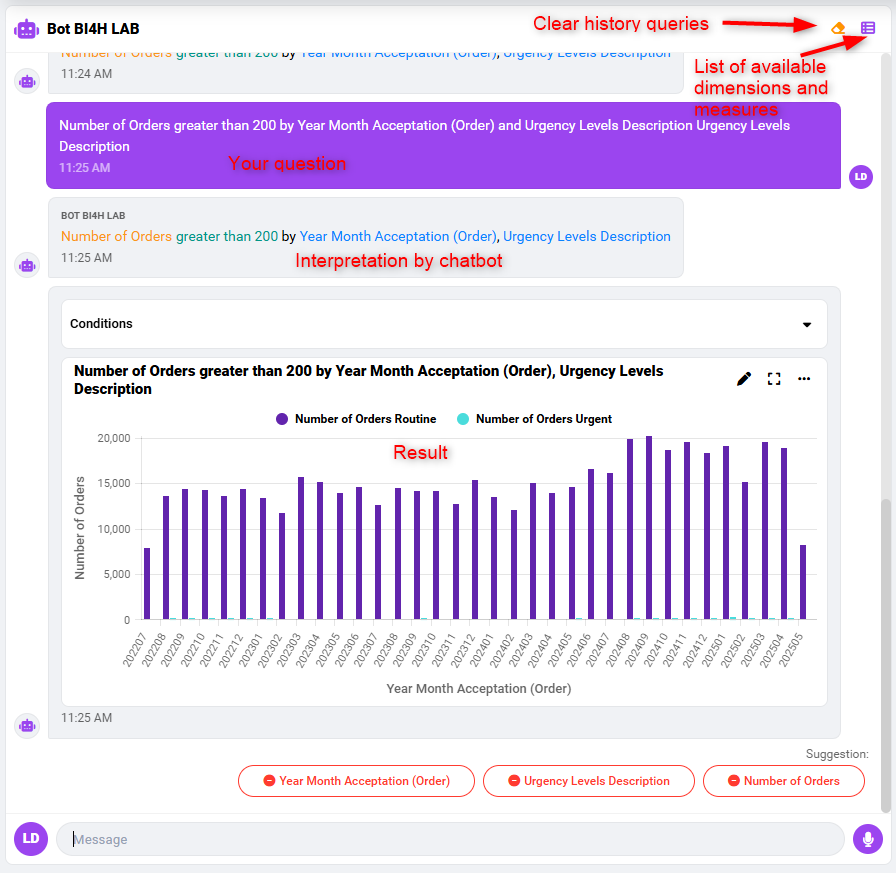
Click the button at the top-right of the chatbot box and choose dimensions and measures from the suggested list


Type Your Request

Enter your request directly into the dialog box. A list of available dimensions and measures will appear while typing.


Dictation

By clicking on the microphone icon at the bottom right of the chatbot window, you can dictate your request (make sure your browser allows the use of the microphone).

Interaction with the result

Once you get the result it's possible to:

  • Change the type of chart

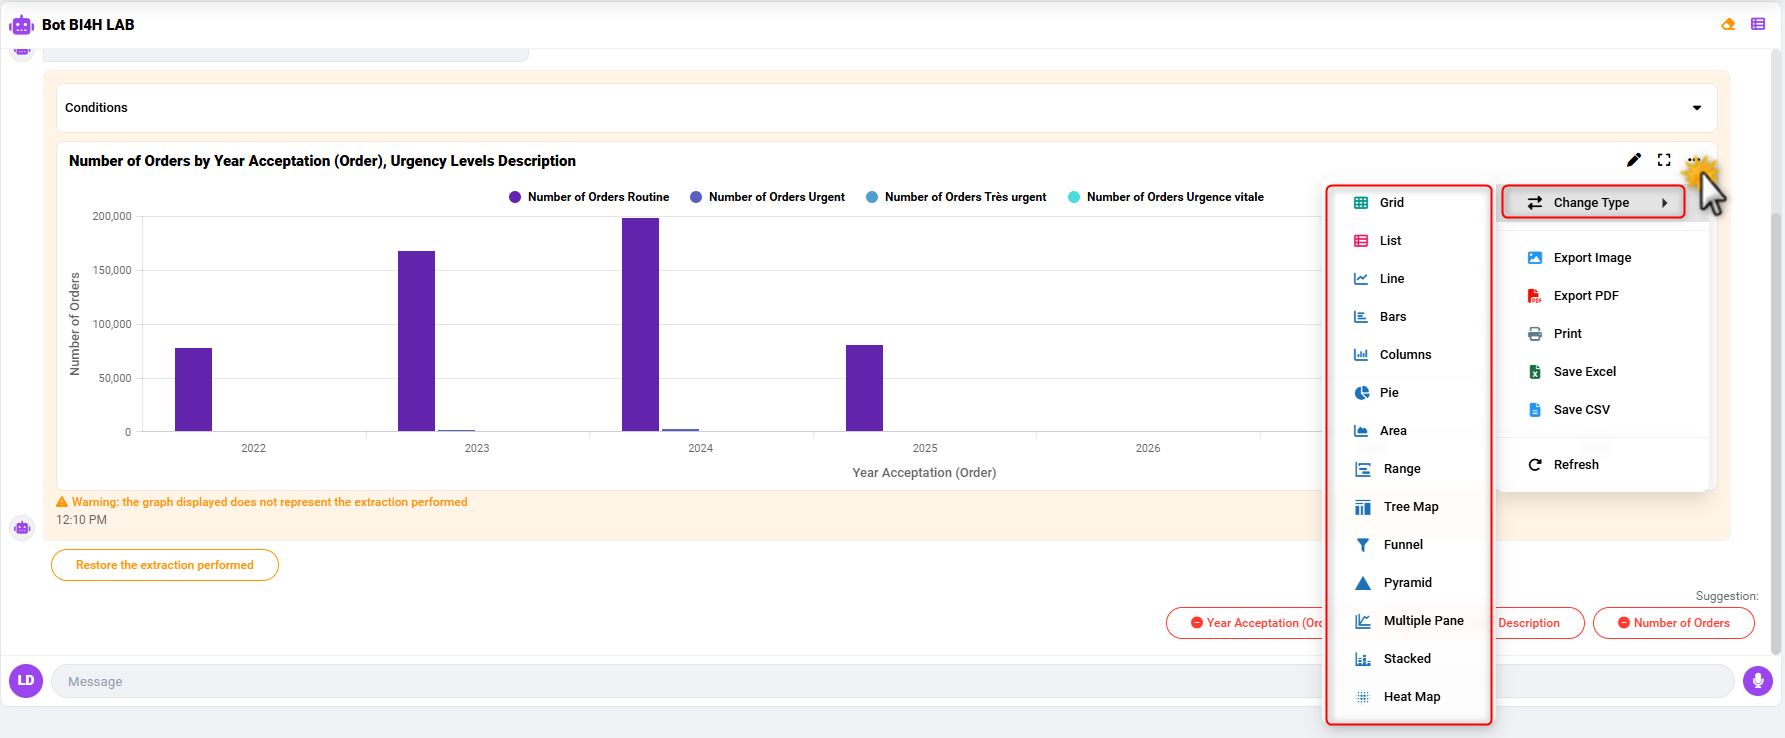
  • Export the result to Image, PDF, Excel, or CSV

  • Add more conditions

  • Customize the display by removing or adding dimensions

Example Queries

To facilitate the use of the chatbot, here are some examples to help you build your own questions:

Filter on measure:  

Number of Orders greater than 220000 by Year Month Acceptation (Order)

Number of Orders > 220000 by Year Month Acceptation (Order)

Filter on a numeric format dimension with a value:

Number of Exams by Execution Zone, with filters Year Month Taking Charge (Exam) equal to 202404

Number of Exams by Execution Zone, Year Month Taking Charge (Exam) = 202404

Filter on a numeric format dimension over a range of values:

Number of patients by gender, age (years) greater than 30

Number of patients by gender, age (years) > 30

Filter on a date format dimension: 

number of exams, date taking charge (exam) between 2024-05-01 and 2024-05-08 

number of exams with filters date taking charge (exam) between 2024-05-01 and 2024-05-08

Filter on a string format dimension: 

Number of exams by execution zone, exam code contains 'NA'


Last update: 19 August 2025
Views: 84

© 2025 Documentation BI4H (EN)

Powered by WordPress

All'inizio ↑ Su ↑