Salta al contenuto

Documentation BI4H (EN)Documentation BI4H (EN)

  • Quick Start
  • Navigation
  • Interactions
  • Charts
  • Tables
  • Filters
  • Modules
  • Data Explorer
  • Self service
  • Quick Start
  • Navigation
  • Interactions
  • Charts
  • Tables
  • Filters
  • Modules
  • Data Explorer
  • Self service
  • Quick start

    • Start up

    • Profile

    • Top tool bar

      • Change theme layout
      • Language selection
    • Elements of BI4H

    • What is the HUB

    • What is the APP

    • What is a module

  • Navigation

    • Tiles & child buttons

    • Navigation bar

    • Stepper

    • Sidenav

    • Bookmarks

    • Schedule

    • Global search

  • Interactions

    • Point & click interaction

    • Change chart type

    • Export widgets

    • Fullscreen

    • Additional details

    • Modal windows

  • Charts

    • Lines

    • Colums

    • Composed lines-columns

    • Bars

    • Area

    • Bubble

    • Pie

    • Heatmap

    • Funnel

    • Treemap

    • Geographical maps

    • Gauge

    • Scatter plot

    • Range

    • Sankey

    • Radar

  • Grids

    • Grids option

    • Simple grids

    • Group grids

    • Pivot

  • Filters

    • Smart Filter Bar

    • Filter layout

      • Single filter
      • Group filter
      • Expanded filter
      • Tree filter
      • Builder filter
      • Search filter
    • Filter types

    • Filter options

    • Interactions

  • Modules

    • Numbers

    • Tab

    • Buttons

    • List Indicator

    • Street maps

    • Aid to interpretation

  • Data Explorer

    • Introduction

    • Configuration

      • Edit module -> Generals
      • Edit module -> Aspect
      • Edit module -> Sharing
    • Create a new query

      • Add fields from Univers
      • Add fields from tables/snippets
      • Conditions sections
      • Advanced mode
    • Existing query

      • Run an existing query
      • Create a query using existing query
    • Sharing

      • Share a query
      • Run a shared query
    • Export results

    • Query category

  • Self service

    • Your first dashboard

      • Adding a new page to the app
      • Adding modules to the page
    • Edit Module -> DATA tab

      • Dimension & Alternative Dimension
      • Measures & Alternatives Measures
      • Categories for alternative data
      • Name of dimensions & Measures
      • Sorting of Dimensions & Measures
      • Visibility of Dimensions & Measures
      • Measures Formatting
      • Measures Threshold
    • Edit Module -> ASPECT tab

      • Title customization
      • Show Legend & Customization
      • Box colors
      • Split module
      • Box Options
      • X Axis
      • Y Axis
      • Chart Colors
      • Type (Rotate, Invert, stack)
      • Zoom
      • Tooltip
      • Average
      • Values
      • Change type
      • Other (Aspect)
    • Edit Module -> INTERACTIVITY tab

      • Action
      • Filters
      • Data
      • Other (Interactivity)
    • Edit page - Generals tab

    • Edit page - Options tab

      • Options (Page)
      • Filters (Page)
    • Edit page - Info tab

    • Edit page - Other tab

    • Rendering examples

      • Column chart combined with a line
      • Stacked chart
      • Chart with opposite axis
      • Chart with a constant line
  1. Docs
  2. Modules
  3. List Indicator

List Indicator

Reading time:

List Indicator is a particular visualization for targets and follow-up of campaigns.

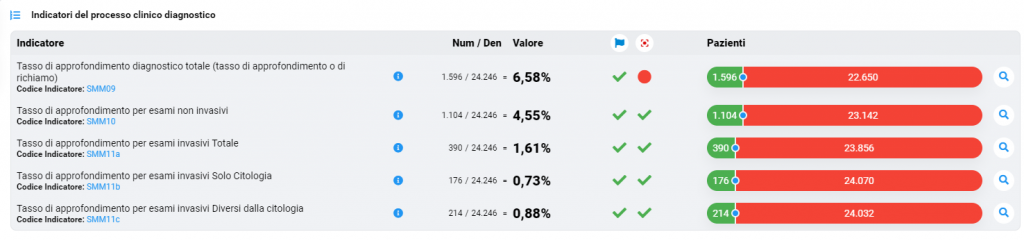
The more complex form is determined by: - numerator - denominator - value. In the example above, the numerator is represented by the green segment and the difference between denominator and numerator by the red segment.


In some cases the algebraic part may not be present, but only the graphic form, which breaks down a certain number that identifies the total into groups.


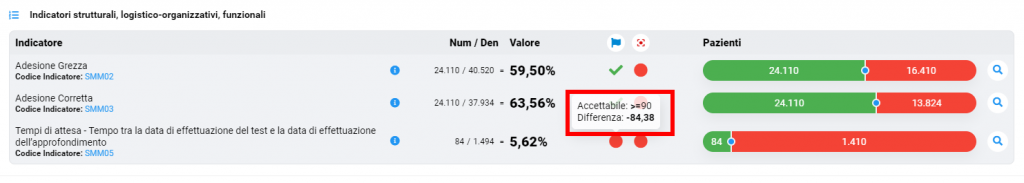
For convenience, the symbols can be shown to determine whether or not the reference targets have been reached and at the mouse-over a tooltip may appear that will indicate the value of the target and the deviation from it.


In some cases from the coloured segments is possible to open modal for more details.

Last update: 8 June 2021
Views: 395

© 2025 Documentation BI4H (EN)

Powered by WordPress

All'inizio ↑ Su ↑