Area
Reading time:
Area charts represent data on XY axises colouring the space between points and X axis.
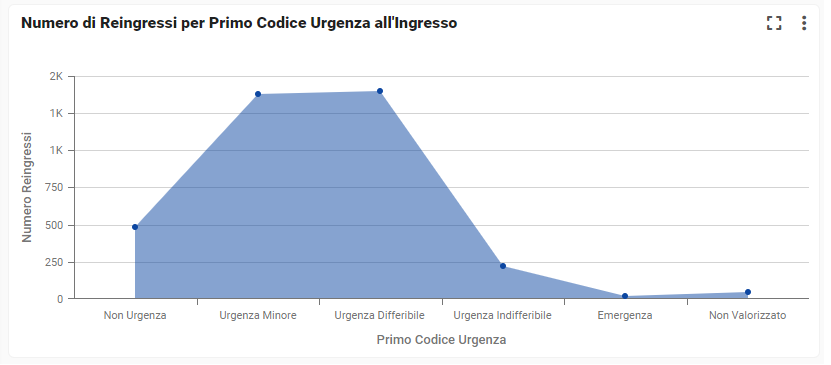
Selection can be done by the points showed.
How to add a Area chart?
Last update: 13 February 2026
Views: 731