Geographical maps
Reading time:
BI4H can represent data with different levels of detail (world, region, provinces, city, districts, etc).
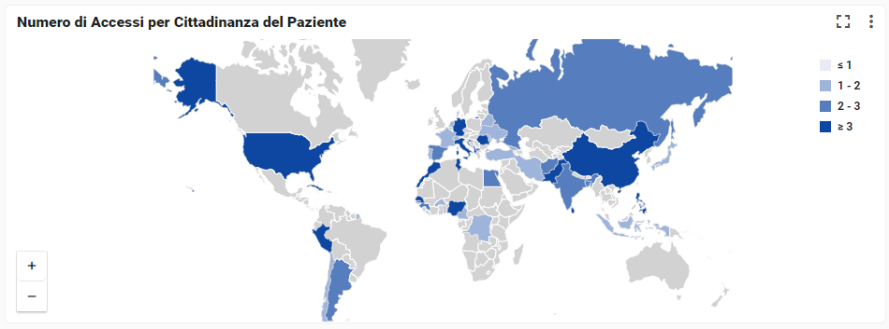
Information can be showed with areas coloured by standard classification of zones (ex. ISO 3166-1, zip code, ecc.):
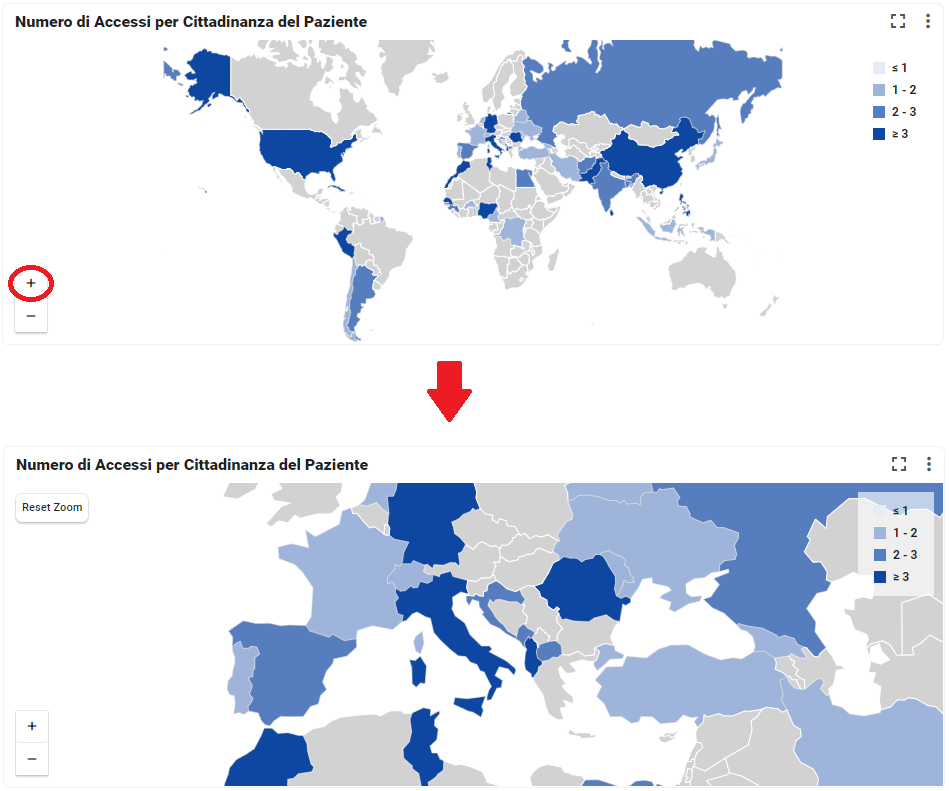
Global vision
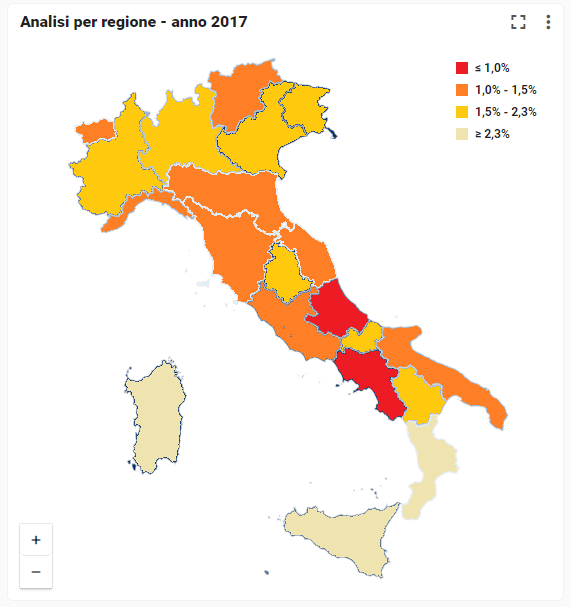
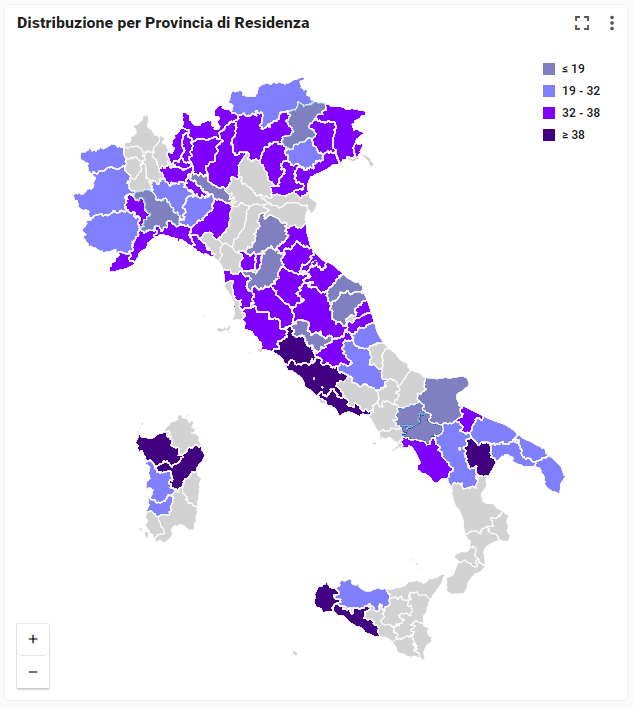
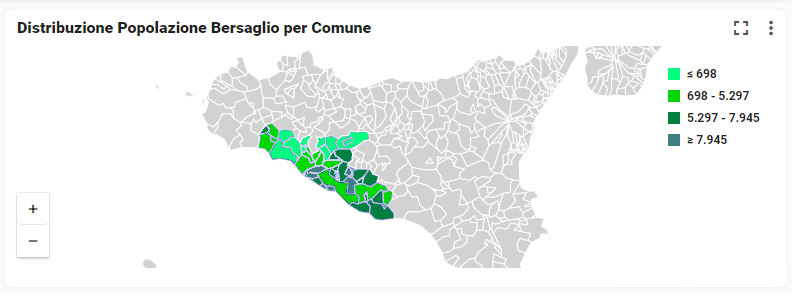
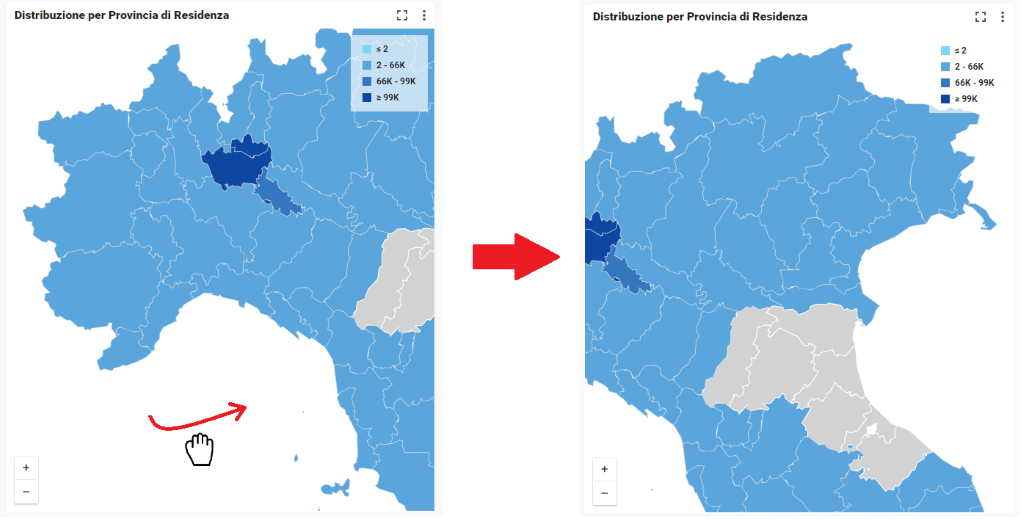
Region, Province, City vision
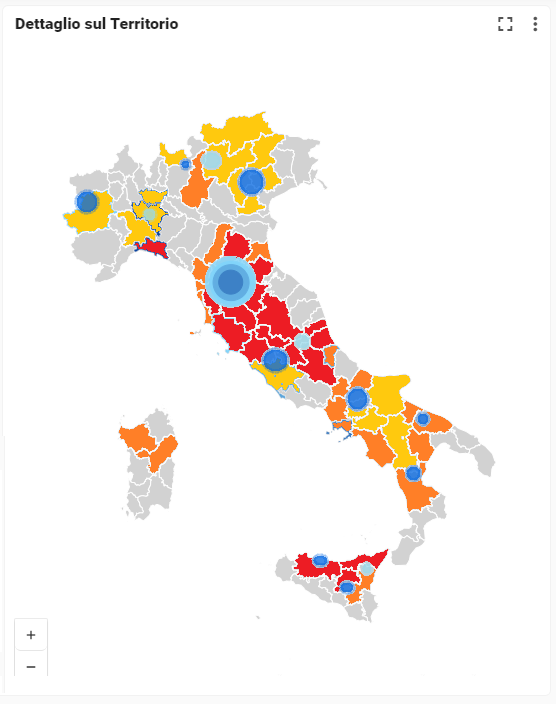
Layouts can be also implemented with geographical coordinates (latitude and longitude) to make puntual analysis.
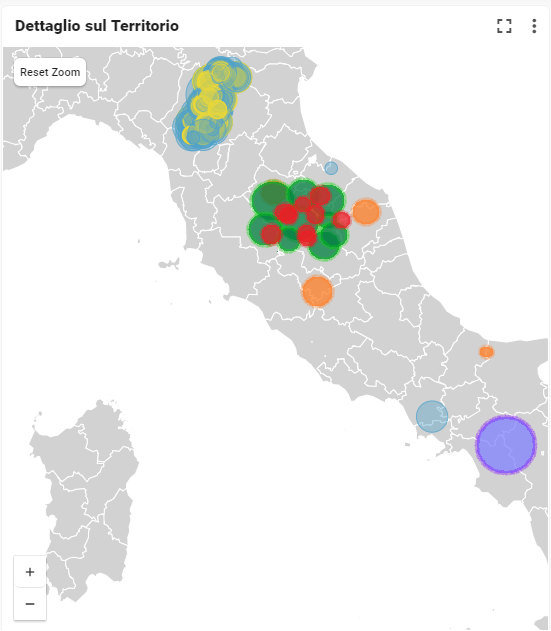
It is possible also have multi-layer maps, which combine puntual information (latitude, longitude) and ares (country, region, province, etc).
Every map can be navigated in every direction by dragging the image with the mouse.
Each map can be zoomed from what is showed by default. This feature allows to dynamically change the scale of representation on the map to change the detail level.
How to add a geographical map module?
1 : Drag and drop a geographical map module to the page.
2 : Add the field for dimension ( e.g. department, region, country etc..), and under CHART tab for dimention, select the dimension type (e.g. latitude, longitude, country code), which depends on the field you added to the dimension
3 : Add the field for measure (e.g. number of patient), and under CHART tab for measure, select the map type (e.g. Area, bubble, etc...) and the point symbol (e.g. circle, square etc...)
4 : Save it
Specfic options:
- Zoom
When you are in edit mode, you have a tooltip with zoom values at the bottom right of the box,

this can help you to customize the zoom with the below options.
