Salta al contenuto

Documentation BI4H (EN)Documentation BI4H (EN)

  • Quick Start
  • Navigation
  • Interactions
  • Charts
  • Tables
  • Filters
  • Modules
  • Data Explorer
  • Self service
  • Quick Start
  • Navigation
  • Interactions
  • Charts
  • Tables
  • Filters
  • Modules
  • Data Explorer
  • Self service
  • Quick start

    • Start up

    • Profile

    • Top tool bar

      • Change theme layout
      • Language selection
    • Elements of BI4H

    • What is the HUB

    • What is the APP

    • What is a module

  • Navigation

    • Tiles & child buttons

    • Navigation bar

    • Stepper

    • Sidenav

    • Bookmarks

    • Schedule

    • Global search

  • Interactions

    • Point & click interaction

    • Change chart type

    • Export widgets

    • Fullscreen

    • Additional details

    • Modal windows

  • Charts

    • Lines

    • Colums

    • Composed lines-columns

    • Bars

    • Area

    • Bubble

    • Pie

    • Heatmap

    • Funnel

    • Treemap

    • Geographical maps

    • Gauge

    • Scatter plot

    • Range

    • Sankey

    • Radar

  • Grids

    • Grids option

    • Simple grids

    • Group grids

    • Pivot

  • Filters

    • Smart Filter Bar

    • Filter layout

      • Single filter
      • Group filter
      • Expanded filter
      • Tree filter
      • Builder filter
      • Search filter
    • Filter types

    • Filter options

    • Interactions

  • Modules

    • Numbers

    • Tab

    • Buttons

    • List Indicator

    • Street maps

    • Aid to interpretation

  • Data Explorer

    • Introduction

    • Configuration

      • Edit module -> Generals
      • Edit module -> Aspect
      • Edit module -> Sharing
    • Create a new query

      • Add fields from Univers
      • Add fields from tables/snippets
      • Conditions sections
      • Advanced mode
    • Existing query

      • Run an existing query
      • Create a query using existing query
    • Sharing

      • Share a query
      • Run a shared query
    • Export results

    • Query category

  • Self service

    • Your first dashboard

      • Adding a new page to the app
      • Adding modules to the page
    • Edit Module -> DATA tab

      • Dimension & Alternative Dimension
      • Measures & Alternatives Measures
      • Categories for alternative data
      • Name of dimensions & Measures
      • Sorting of Dimensions & Measures
      • Visibility of Dimensions & Measures
      • Measures Formatting
      • Measures Threshold
    • Edit Module -> ASPECT tab

      • Title customization
      • Show Legend & Customization
      • Box colors
      • Split module
      • Box Options
      • X Axis
      • Y Axis
      • Chart Colors
      • Type (Rotate, Invert, stack)
      • Zoom
      • Tooltip
      • Average
      • Values
      • Change type
      • Other (Aspect)
    • Edit Module -> INTERACTIVITY tab

      • Action
      • Filters
      • Data
      • Other (Interactivity)
    • Edit page - Generals tab

    • Edit page - Options tab

      • Options (Page)
      • Filters (Page)
    • Edit page - Info tab

    • Edit page - Other tab

    • Rendering examples

      • Column chart combined with a line
      • Stacked chart
      • Chart with opposite axis
      • Chart with a constant line
  1. Docs
  2. Grids
  3. Group grids

Group grids

Reading time:

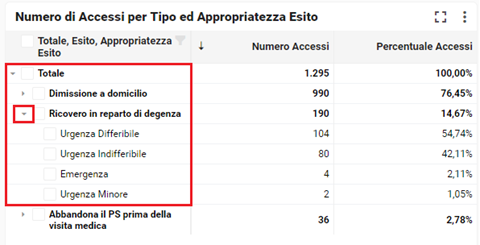
Group grids allow drill-down navigation of the data.

You can recognize them by the little arrow on the first row.

Clicking on the arrow let you expand and so open the drill-down on the correspondent node.

If the arrow points on the bottom it means that the node is open so you can only close the drill-down.


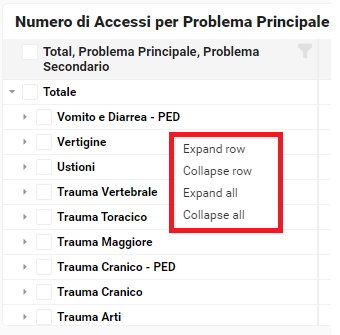
To make the drill-down it is also possibile to use the menu from the right click.

From that it is also possibile to expand or close all nodes at time.


 This section is reserved for people who have the "Editor" role.

How to add and configure a group grid?

Add a group grid.

This is the default rendering, you can see only the first level, if have multiple levels.

You can define the expansion level of the table display in aspect tab.

Here is the rendering.

Last update: 4 October 2024
Views: 451

© 2025 Documentation BI4H (EN)

Powered by WordPress

All'inizio ↑ Su ↑